The Housing Fix Few Cities Want To Copy
Austin brought rents down 19%. Boston flew a delegation out to learn how, took detailed notes, came home, and did very little. This article explores what can easily be done.

Austin brought rents down 19%. Boston flew a delegation out to learn how, took detailed notes, came home, and adopted the one reform that changes nothing.
01 / Two cities, same economy, opposite results
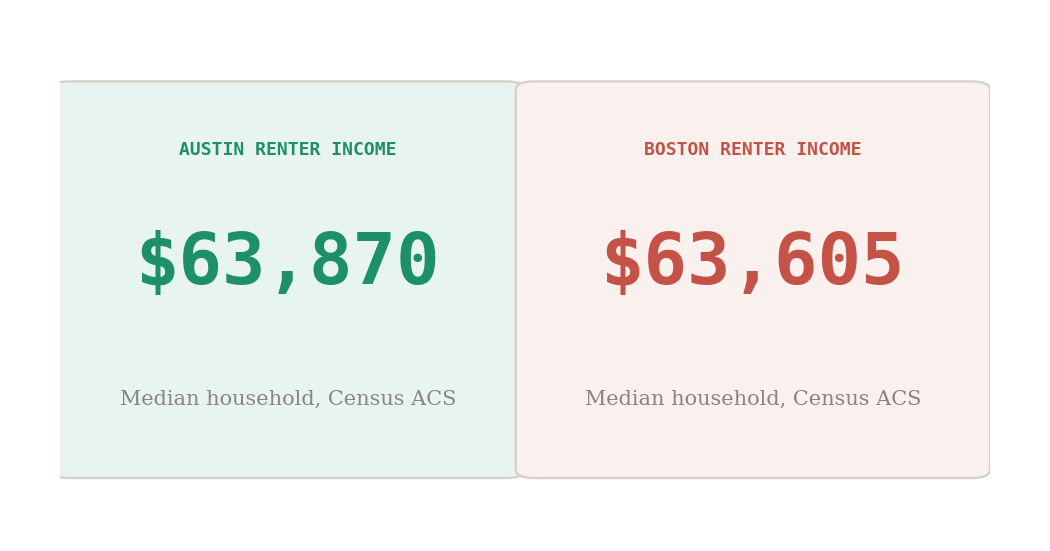
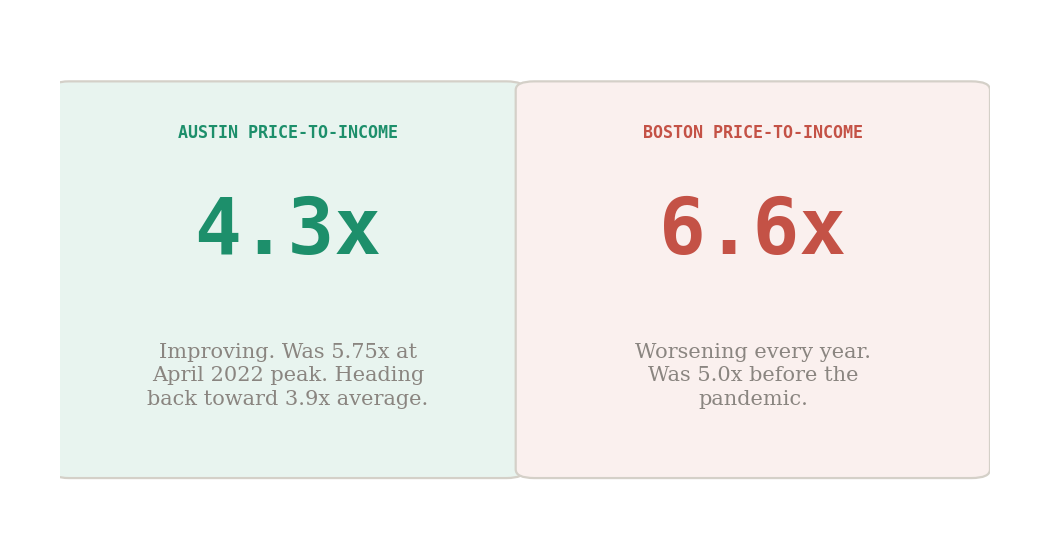
The conventional take on Austin's housing market is that a tech boom overheated it and a tech correction cooled it off, the kind of tidy cause-and-effect story that sounds right until you put it next to the numbers for every other Texas city that went through the same economic cycle and got the opposite result. Renters in Austin and Boston earn, to within $265 of each other, the same median household income, and the two cities have different tax codes, different insurance costs, and different climates that make any straight dollar comparison slightly messy, but the rent trajectory tells a story that cost-of-living adjustments cannot explain away.
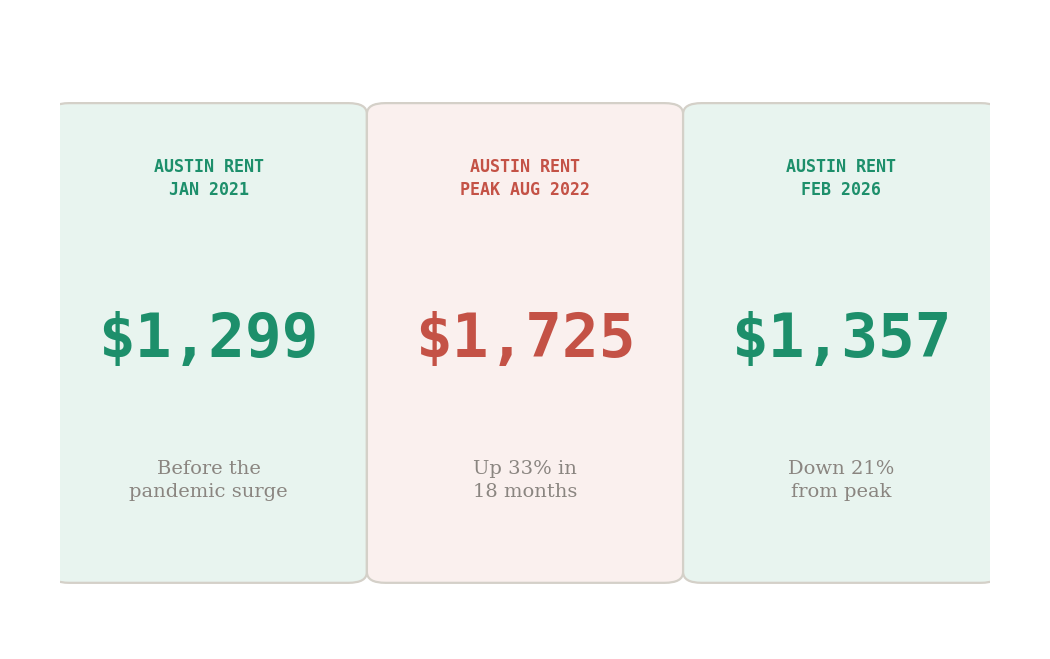
Austin's rents did not gently deflate from a low base, they spiked to $1,725 a month at their August 2022 peak, a 33% climb in eighteen months that had renters paying more than they had ever paid in the city's history, and then they fell, steadily, for four consecutive years, back through 2021 levels and below them in real terms, while Boston's rents kept climbing like a staircase that forgot to include a landing.
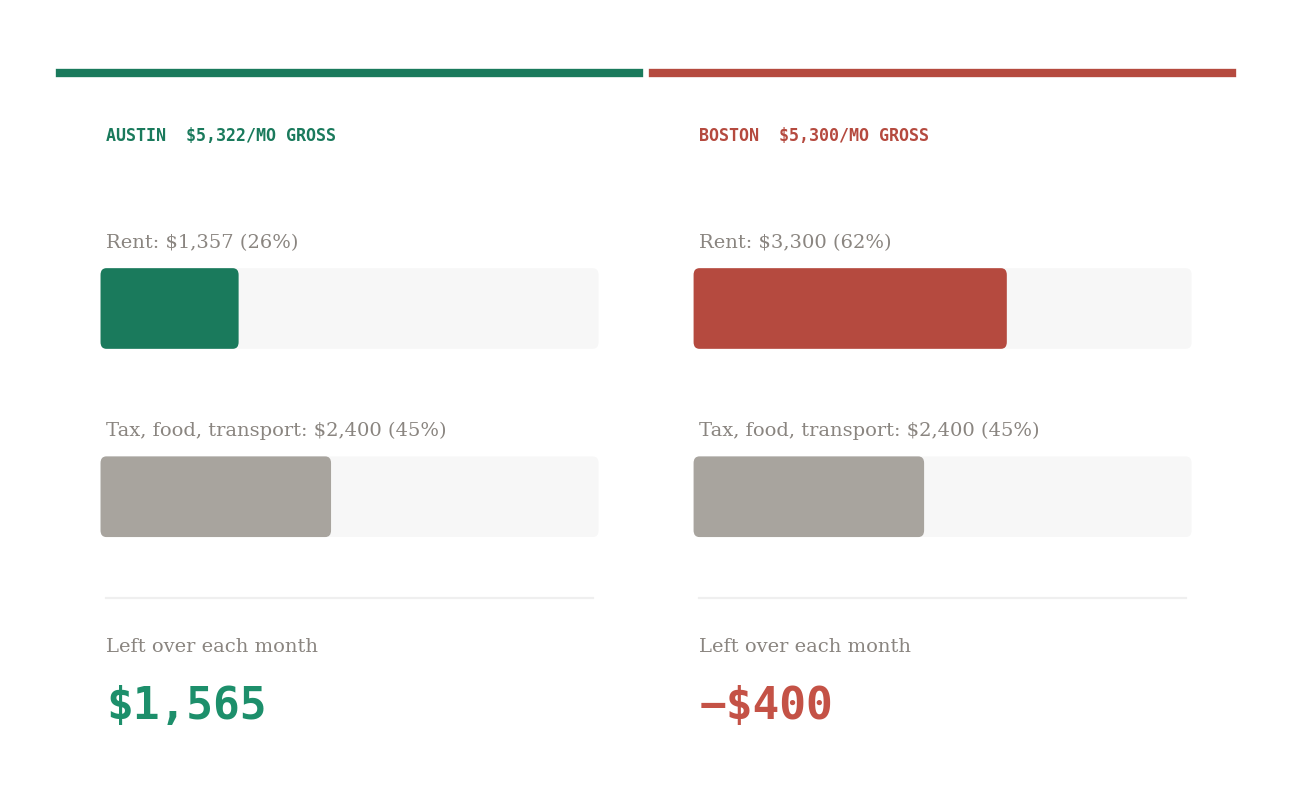
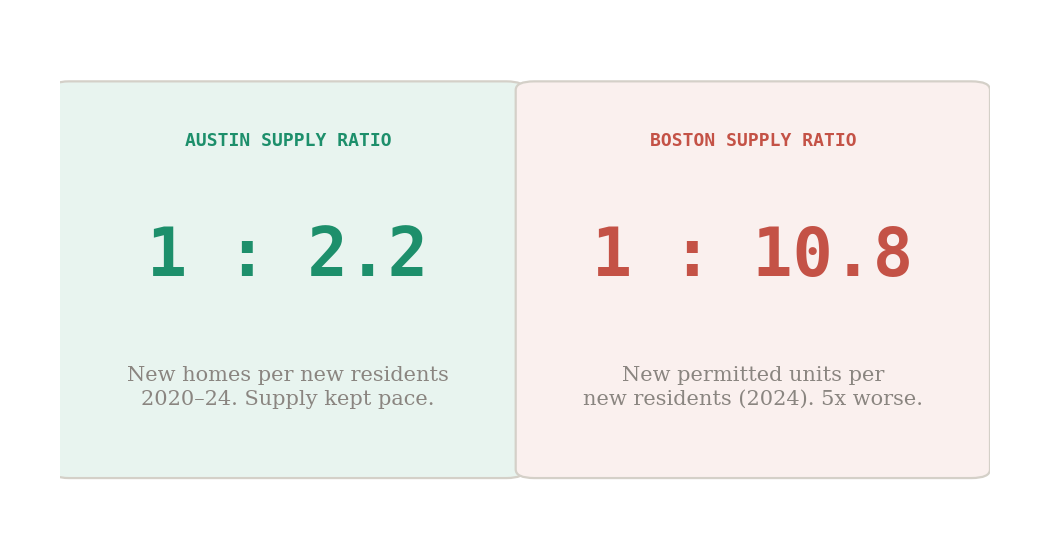
Two populations earning the same money, one choosing between neighborhoods and the other choosing between rent and groceries, and the comfortable version of this story blames Austin's tech correction, as though a few thousand layoffs in a metro that still added 58,000 residents between 2023 and 2024 can explain rents falling 21% while the population grew. If weakened demand were carrying the explanation by itself, the same pattern would show up in Dallas, Houston, and San Antonio, cities that share Austin's state, tax code, and post-pandemic economy but reformed none of their zoning.
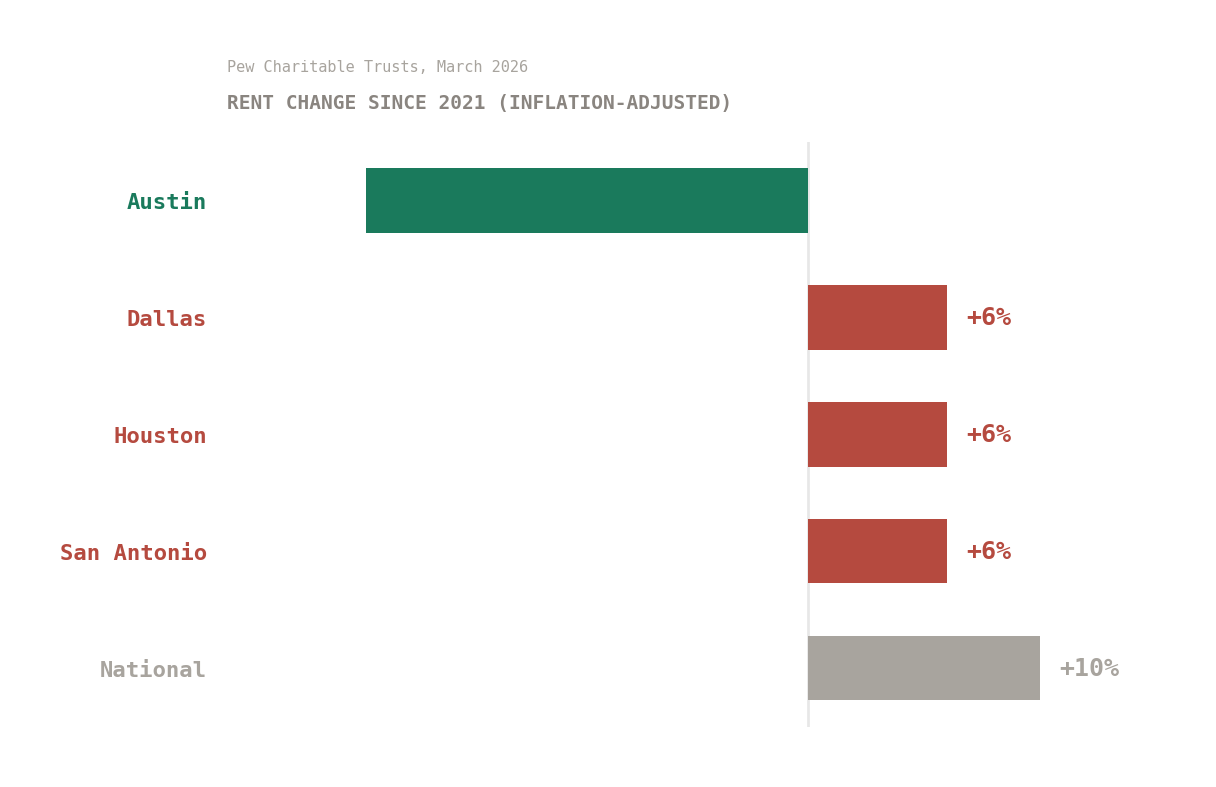
Four Texas metros, one state, one set of interest rates, one post-pandemic hangover. The Pew Charitable Trusts ran this comparison in March 2026, and whatever variable you want to propose for Austin's rent decline, it has to explain why three cities with the same macroeconomy moved in the opposite direction. Supply is the only candidate that survives the test.
02 / The playbook nobody thought would survive
Austin's first attempt at fixing housing was a comprehensive zoning overhaul called CodeNEXT that tried to rewrite the entire land development code in one package, the municipal equivalent of rewiring a house while the family is still living in it. Opponents with lawyers dragged it into court in 2017, wrapped the corpse in environmental objections, and buried it in 2018. The city absorbed a lesson that reform-minded politicians in every American city should have tattooed on the inside of their eyelids: a bundle of reforms packaged as a revolution gets treated like one, and revolutions have enemies who organize faster than supporters.
So Austin came back quieter, one rule at a time, each change narrow enough to survive on its own and to bore its opponents into underreacting, and Boston, operating under the same national economy and the same housing pressure, took a different path, one that involved passing laws with genuine enforcement provisions, real penalties, the Attorney General authorized to sue non-compliant towns, and then watching as 177 municipalities found ways to technically comply while keeping their residential neighborhoods untouched, the legislative equivalent of installing a state-of-the-art security system and then leaving the back door propped open with a brick.
The gap between what gets announced and what gets built is the housing version of the same gap that runs through AI productivity claims, where the narrative is optimized for press conferences and the outcomes are measured in spreadsheets nobody reads.
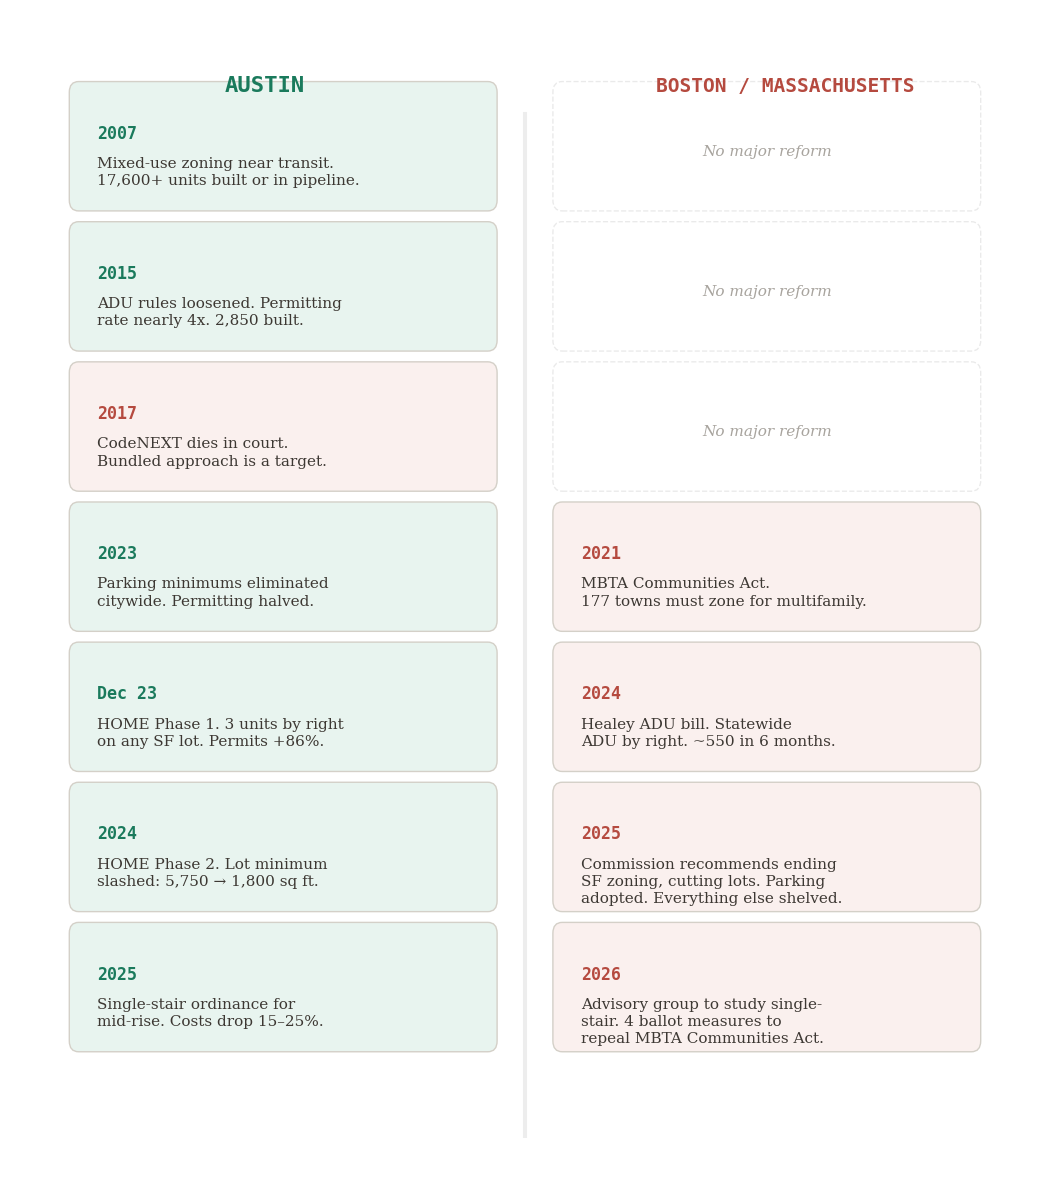
Austin has been compounding reforms for eighteen years, each one building on the last the way interest compounds in a savings account, except the returns are measured in apartments rather than dollars. Massachusetts passed its first significant housing legislation in 2021 and has spent much of the time since watching communities comply with the letter of each new law while quietly suffocating its intent, a process that resembles a student who turns in a technically complete essay that manages to say nothing, correct on every rubric and useless in every way that matters.
The compliance-without-substance dynamic is not unique to housing, because the same pattern of institutions performing reform while quietly preserving the status quo shows up in every system where the people writing the rules are the people the rules are supposed to constrain.
03 / Same dirt, different rules, different cities
The housing gap between Austin and Boston looks, from a distance, like a single large problem that requires a single large explanation. Up close it dissolves into five specific policy choices, each one with a measurable consequence, each consequence compounding with the others in ways that explain why one city's renters have $1,500 left at the end of the month and the other city's renters are $400 in the hole on the same income.
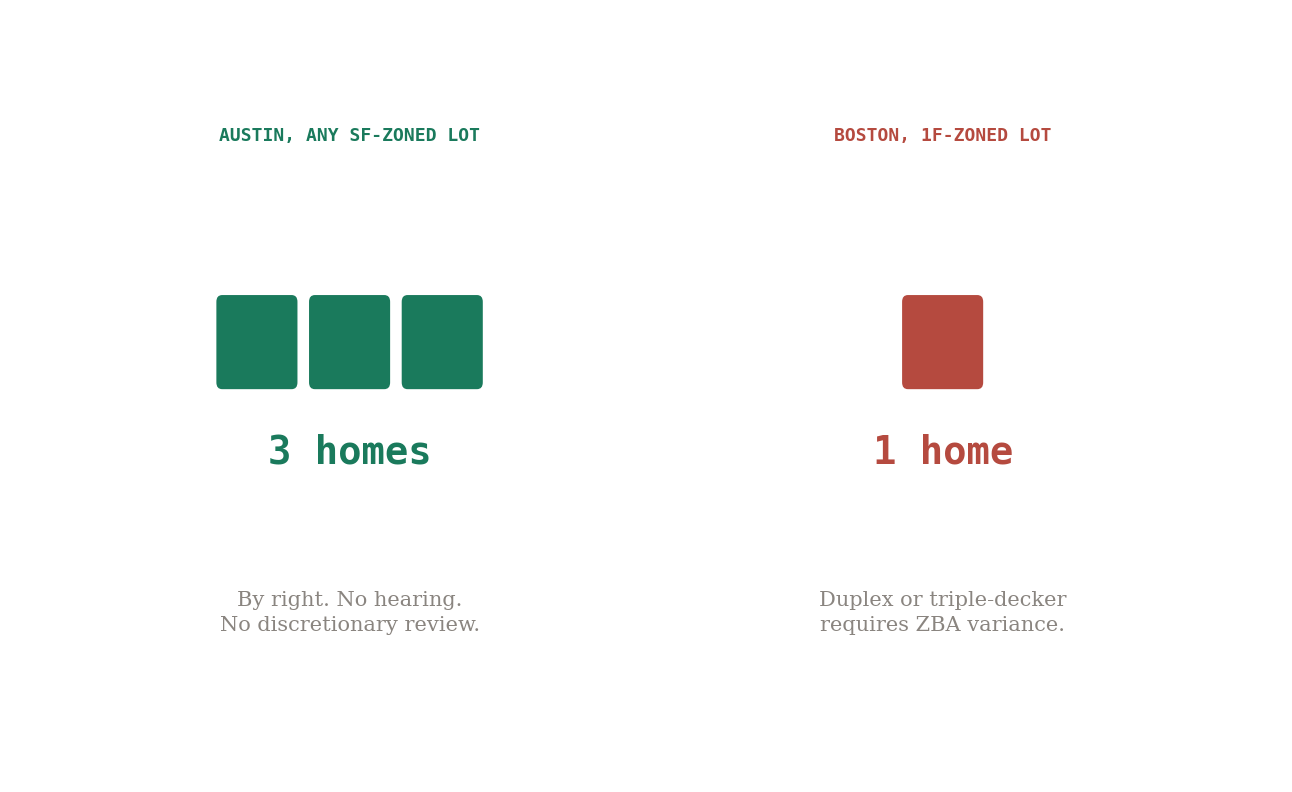
Boston has 1F zones, 2F zones, and 3F zones, which sounds like a menu of options until you realize that a homeowner in a 1F zone who wants to build a duplex on a lot identical in size to the one next door in a 2F zone needs a variance from the Zoning Board of Appeals, a process that adds months and costs thousands and might get denied entirely, while in Austin, HOME made every single-family zone equivalent to Boston's 3F and then removed the hearing. Same lot, same square footage, same city infrastructure, completely different answer from City Hall depending on which zone the lot was drawn into, which in most cases was decided decades ago by people who are no longer alive to explain their reasoning.
That zoning difference, multiplied across tens of thousands of lots in each city, is the mechanism that connects a rule written in a municipal code to a rent check written at a kitchen table, and each of the five policy differences between the two cities operates on the same principle: a rule either allows the building or it doesn't, and the building either exists or it doesn't, and the rent either has competition or it doesn't.
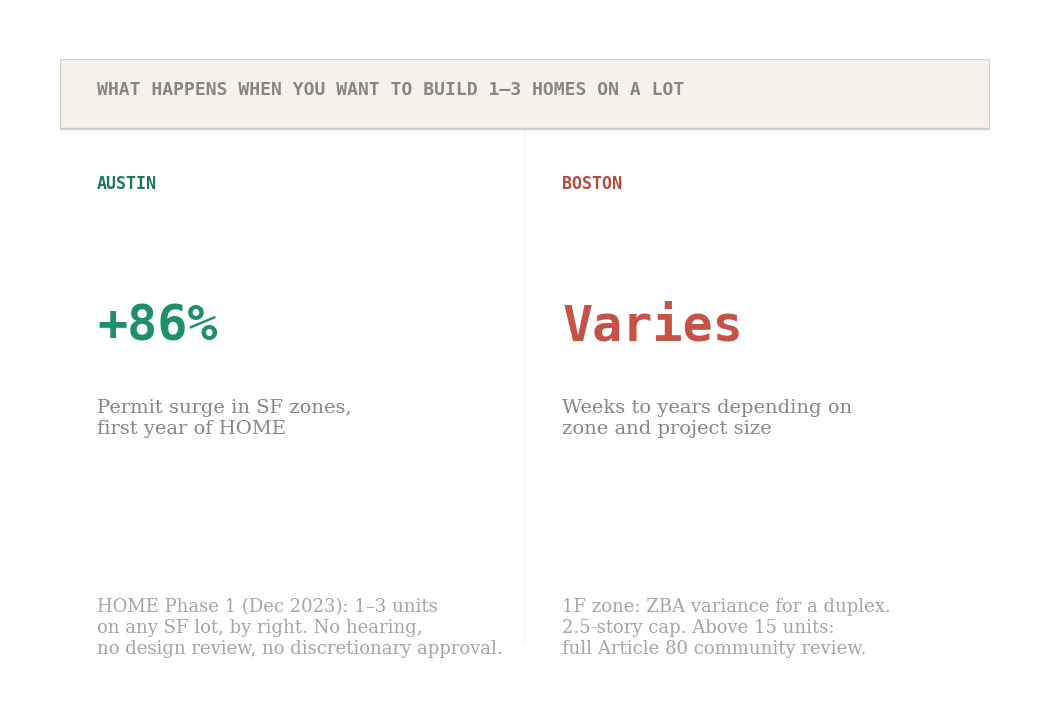
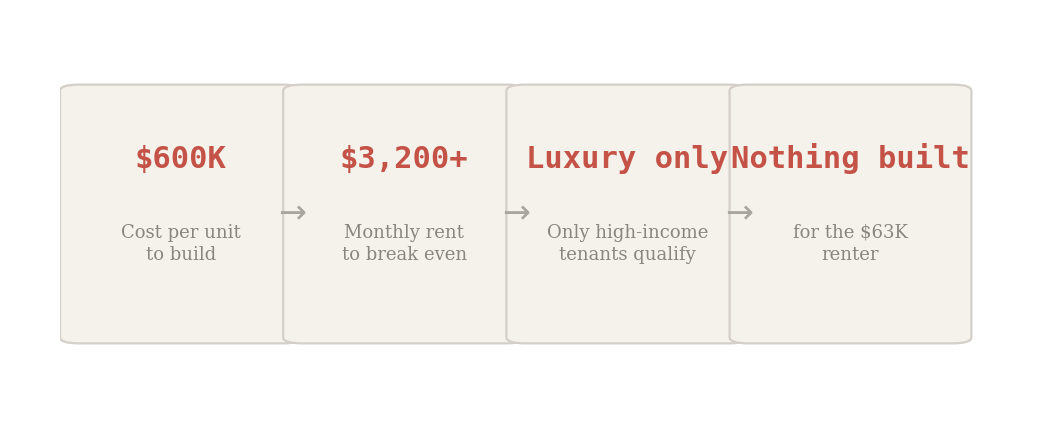
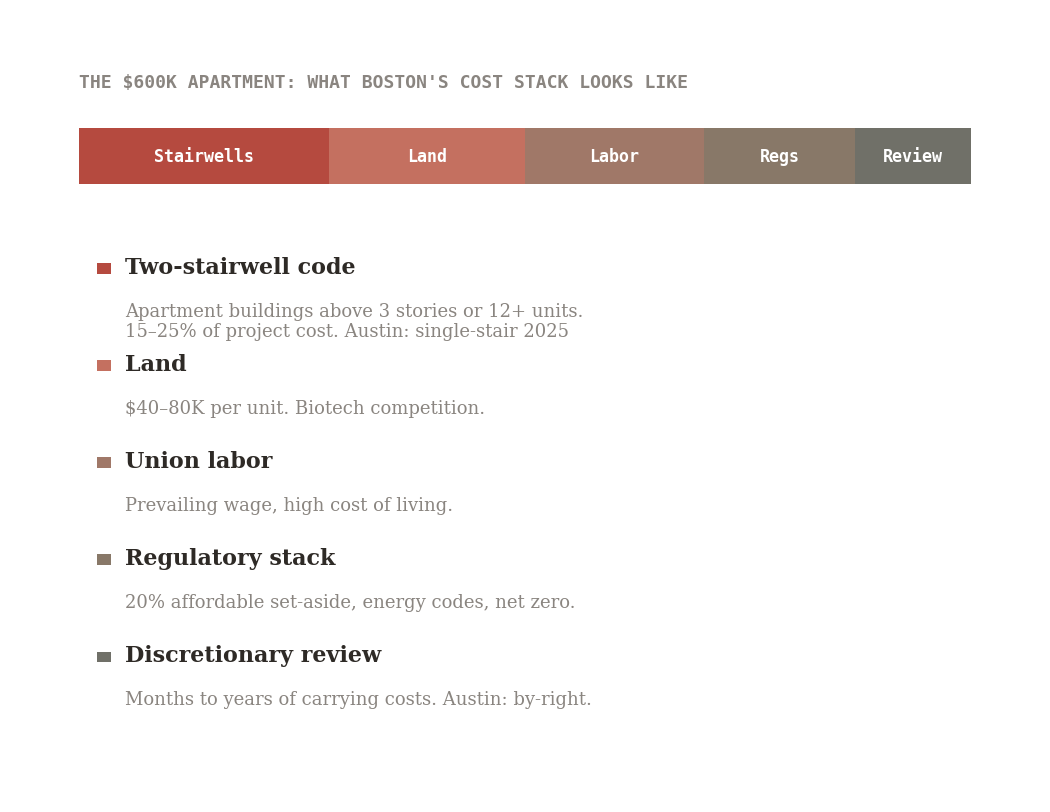
Discretionary review works like a second lock on a door the city already unlocked with its zoning code, a process that gives every adjacent property owner, every neighborhood association, and every city councilor looking for an issue a chance to slow, modify, or kill a project that technically complies with every rule on the books, and the cost of that delay, measured in months of financing charges, architecture revisions, and legal fees, does not disappear when the permit finally arrives but gets baked into the project budget and divided across every unit in the building, arriving eventually on a rent check addressed to someone who has no idea why their apartment costs what it costs and no way to trace it back to the hearing they never attended for the variance they didn't know was needed.
Boston has one neighborhood that already proved what happens when you strip this friction out, a before-and-after running inside the same building department with the same staff.
Greater Boston has thousands of pre-zoning triple-deckers, the three-story, three-unit buildings that sit on lots across Dorchester and Somerville and Jamaica Plain, housing working families in the neighborhoods those families built, and every single one of those buildings was constructed on a lot that is now too small to be legal under current zoning, which means the most successful housing form in the region's history, the one that actually built the middle-class neighborhoods people are now paying $3,300 a month to live in, has been retroactively declared illegal to replicate on the land right next to the buildings that proved it works.
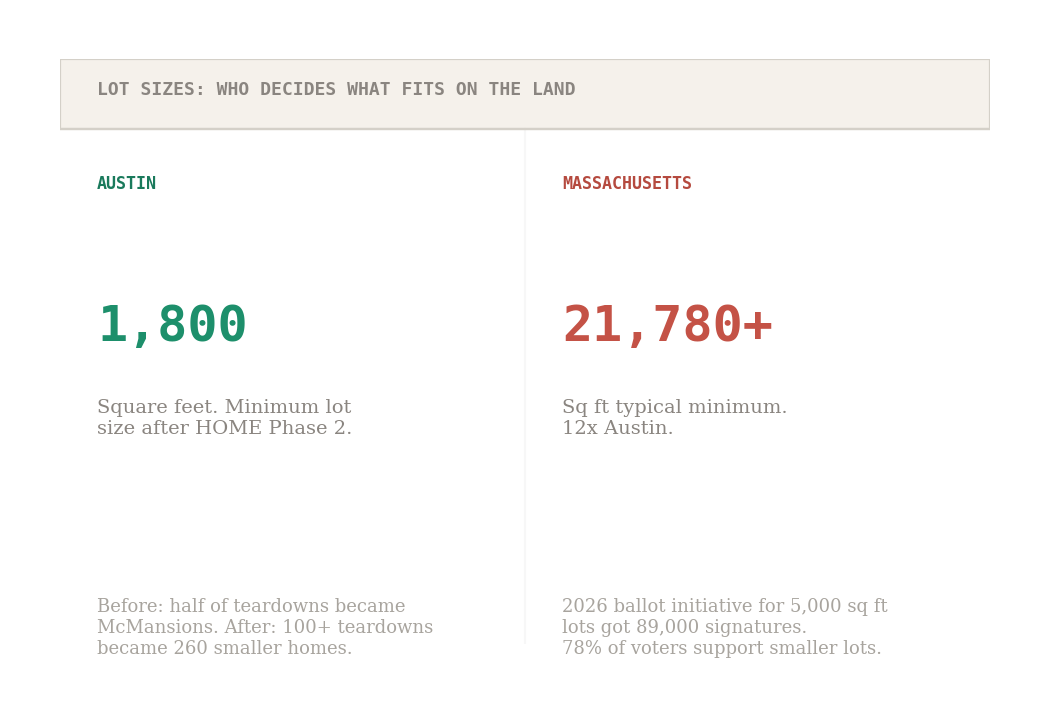
Boston's commission recommended in 2025 what Austin passed in 2023: duplexes by right on all residential lots, up to four units on lots with sewer and water. Oregon did it. Vermont did it. Massachusetts took the recommendation, thanked the commissioners for their service, and filed it in the drawer where good ideas go to age gracefully and die quietly.
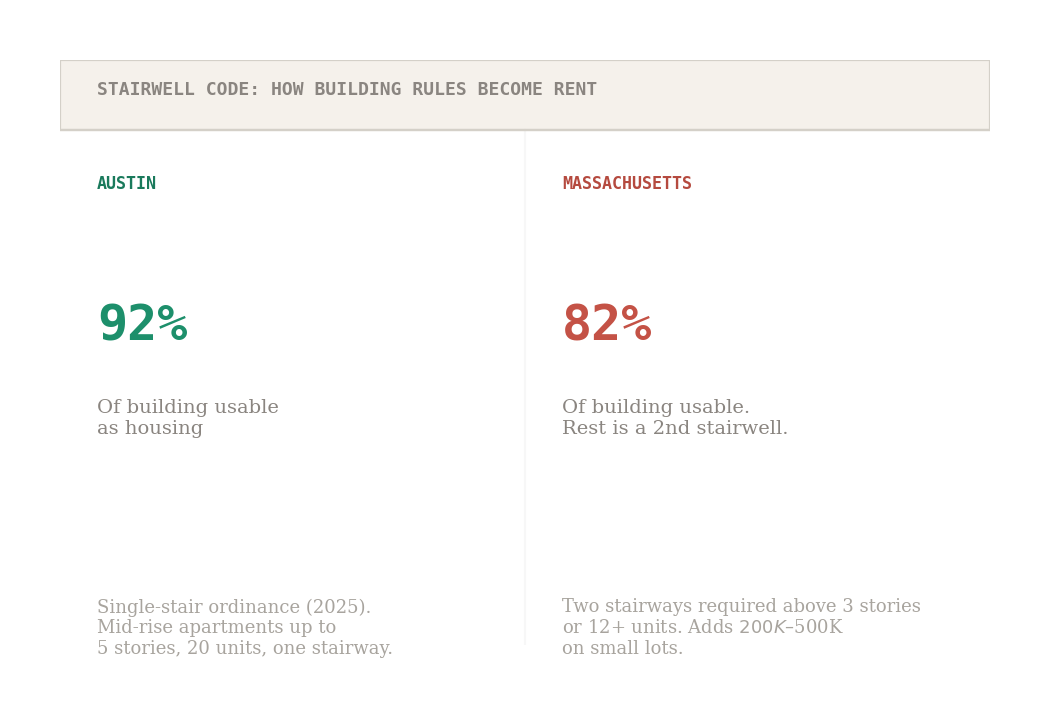
The chain from building code to rent check runs through every line item a developer has to cover before a single tenant moves in, and on a typical Boston parcel of 3,000 to 5,000 square feet, the second stairwell consumes the space where three apartments would have been, which means the developer needs to recover the same construction cost from fewer units, which means higher rent per unit, which means the building code rule becomes a rent premium the tenant pays without knowing it exists.
Harvard's Joint Center for Housing Studies estimates that allowing single-stair mid-rise buildings could unlock 130,000 new homes near transit across Greater Boston, a number with the kind of zeroes on it that ought to make a governor reach for a pen, but Massachusetts signed an executive order in February 2026 to form an advisory group to study whether to allow the construction type that Austin has already passed into law, that Seattle and New York already permit, and that every country in Europe has been building with for decades, which is the regulatory equivalent of forming a committee to investigate whether umbrellas work while standing in the rain.
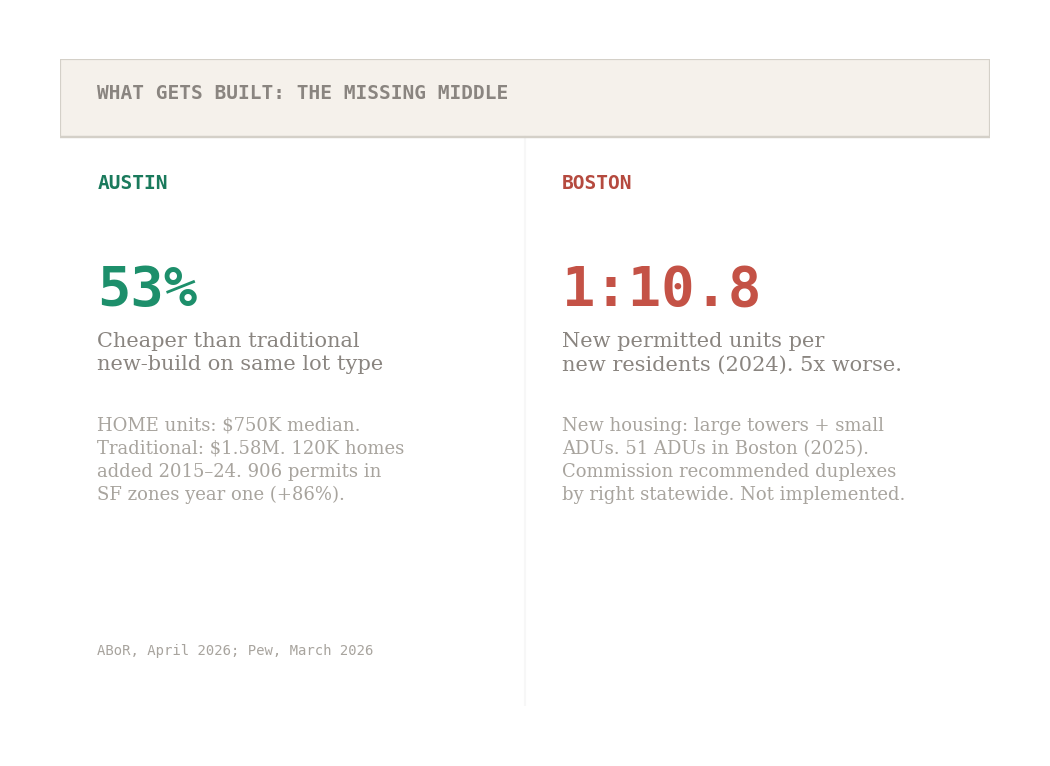
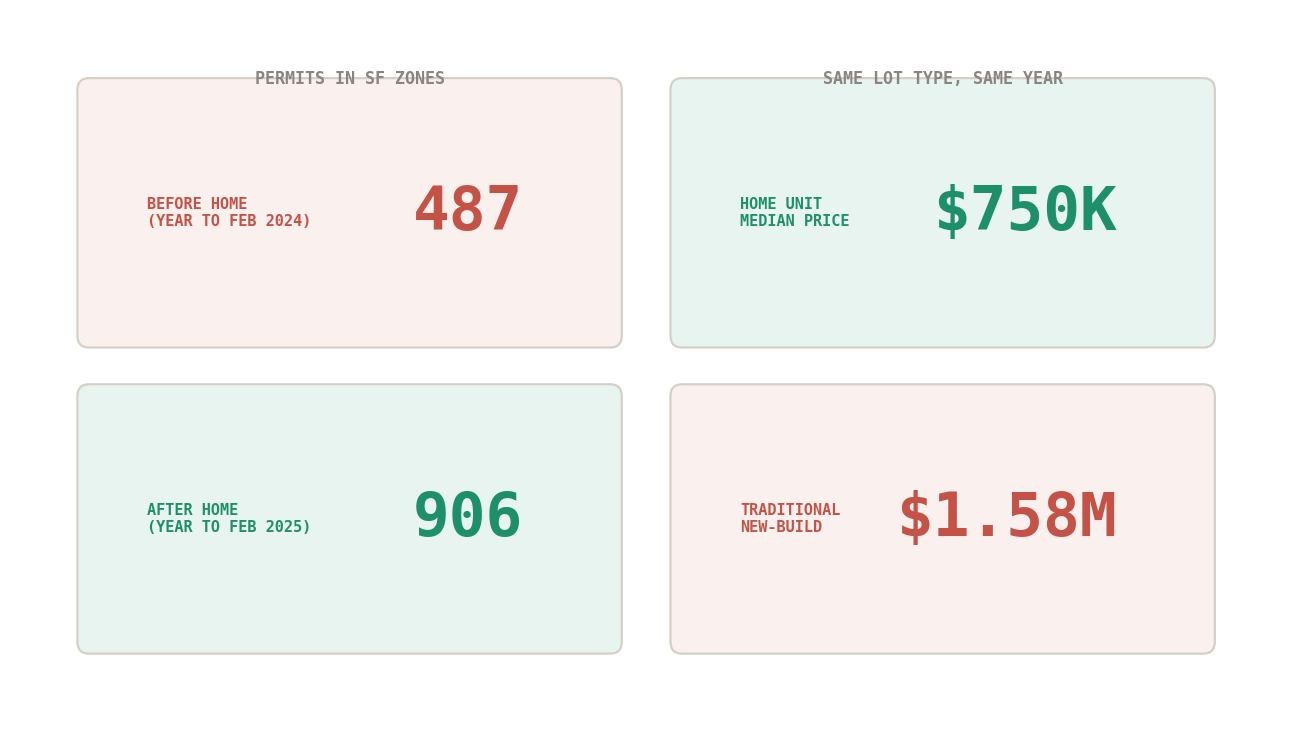
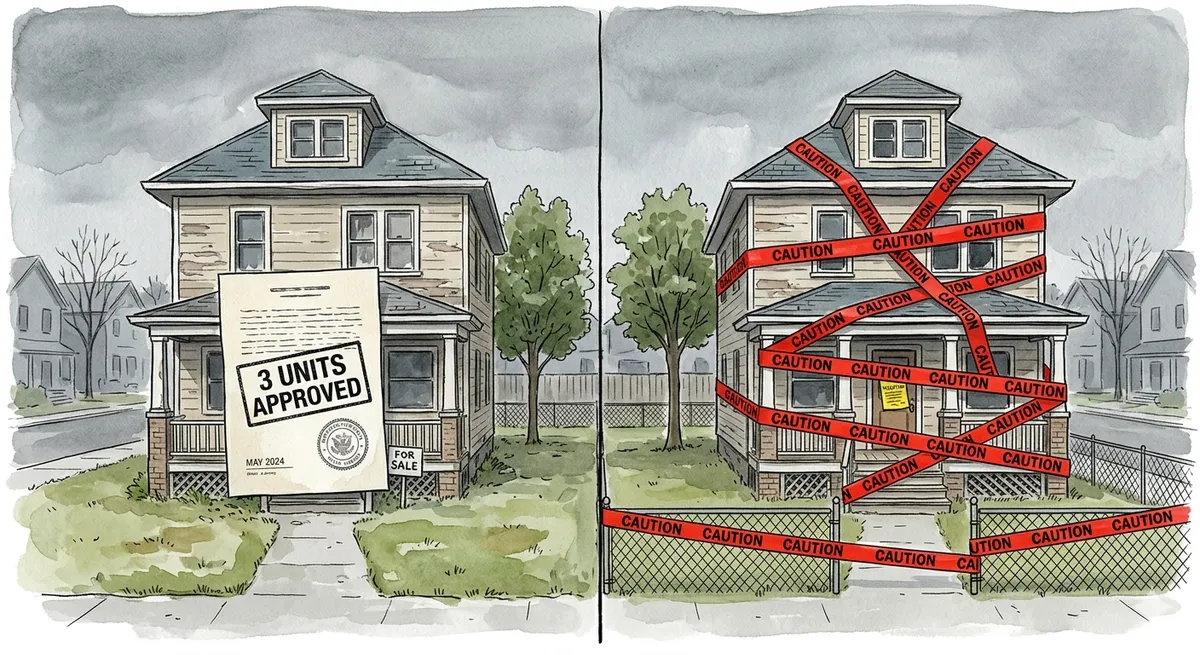
A HOME unit sells for $750,000 and a traditional single-family new build on the same type of lot sells for $1.58 million, which means the zoning change did not merely produce more housing on the same land but produced housing at roughly half the price per unit, and the only thing that changed between those two numbers was a piece of paper at City Hall that said "three units allowed" where it used to say "one."
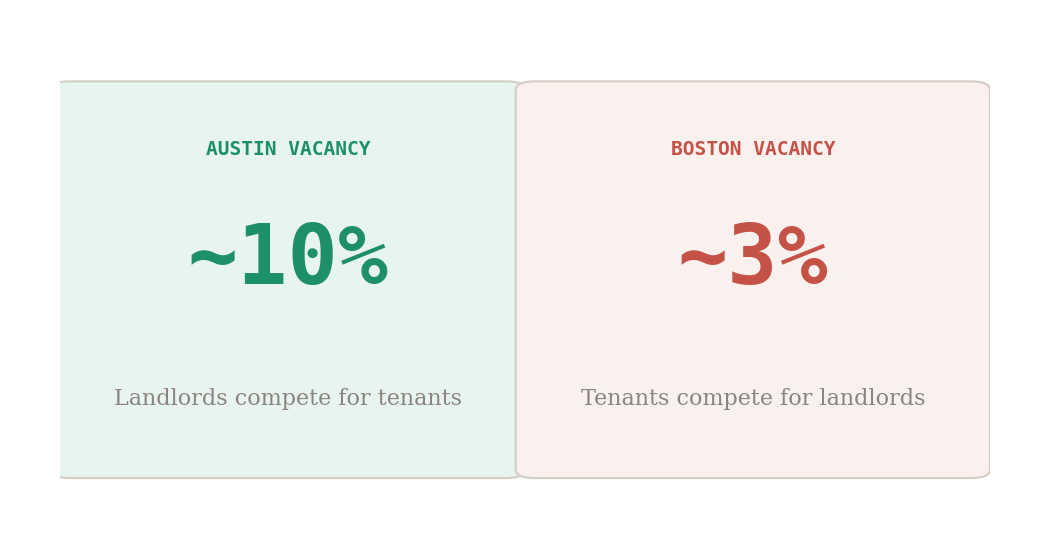
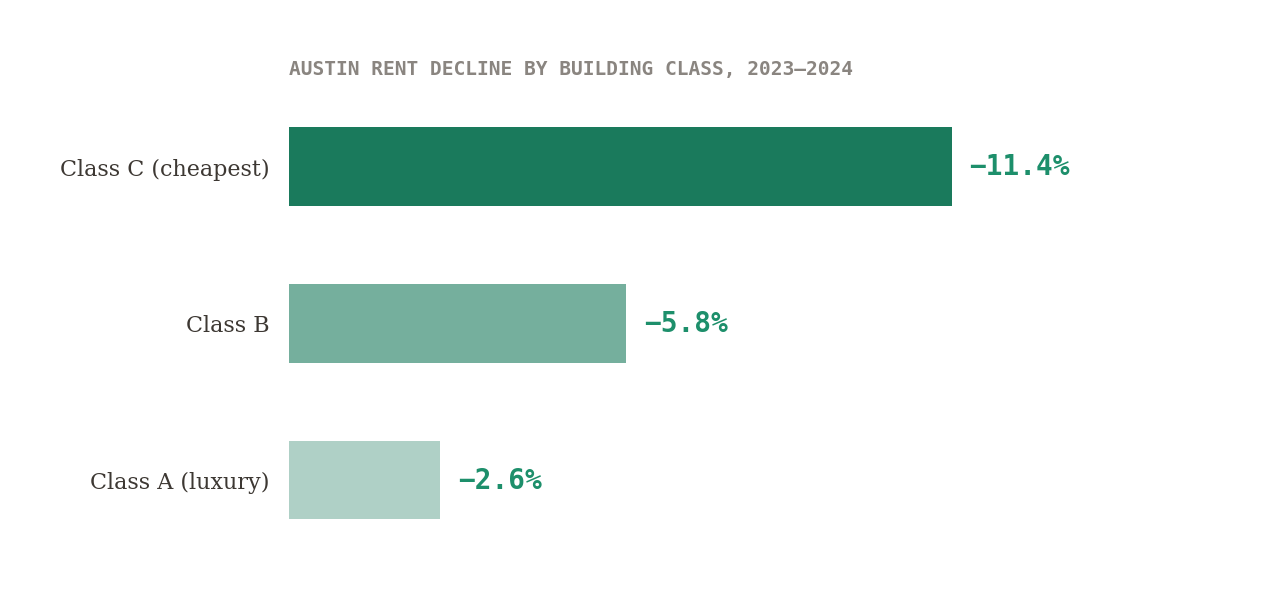
The NIMBY argument that new construction only benefits wealthy tenants, which is the rhetorical foundation of every neighborhood opposition campaign from Back Bay to Berkeley, encountered something inconvenient in Austin: a dataset large enough to test it. When Pew tracked rents by building age and quality, the decline was largest in Class C buildings, the oldest and cheapest apartments, the ones where a family earning $63,000 actually lives.
The mechanism is called filtering and it works the way competition works in any market: a new luxury building opens, tenants who can afford it leave their older apartment, the older building now has a vacancy it needs to fill, the landlord drops the rent to fill it, and the rent reduction cascades downward through the housing stock like water finding its level, which means the family earning $63,000 gets a cheaper apartment delivered by a building they will never set foot in, paid for by a developer they have never heard of, enabled by a zoning change they did not vote on, and the only thing that had to happen for all of it to work was that somebody, somewhere, was allowed to build something.
04 / Boston took the tour and bought the t-shirt
In December 2024, Boston city councilors Henry Santana, Enrique Pepén, and Sharon Durkan hosted Austin's Mayor Pro Tem Leslie Pool and councilors Zo Qadri and Chito Vela for a two-day exchange that included a planning hearing at City Hall, meetings with Cambridge's council, a walking tour of Somerville, and a public panel at the Boston Public Library, the kind of thorough, earnest, well-organized policy tourism that Boston has elevated to an art form over the years, the city's special talent for studying a solution with the intensity of a graduate student and then implementing it with the urgency of a retiree who has decided that actually the garden can wait until spring.
The pattern of studying solutions without implementing them is the governance equivalent of what happens inside companies after layoffs, where surviving employees learn to perform engagement without risking the pushback that might actually change something.
The Commission on Unlocking Housing Production published its recommendations a few months later: drop minimum lot sizes, repeal parking minimums, end single-family zoning statewide, allow duplexes by right, study single-stair reform. The recommendations mapped, almost line for line, onto the reforms Austin spent a decade passing one at a time.
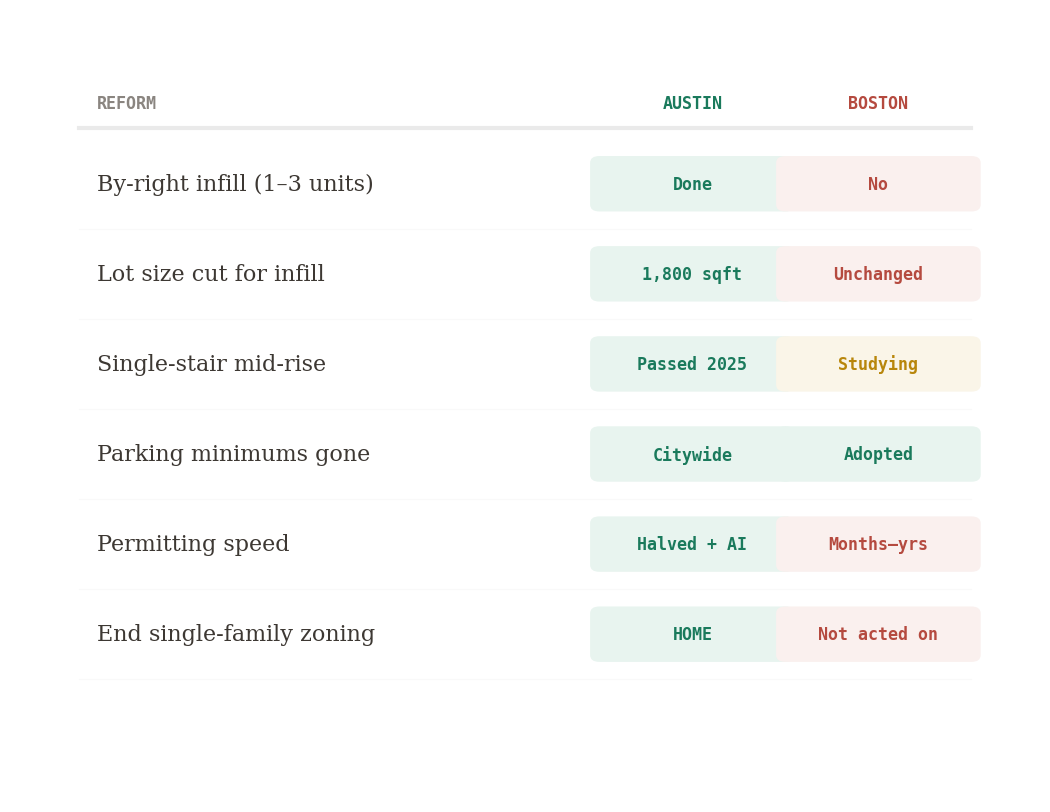
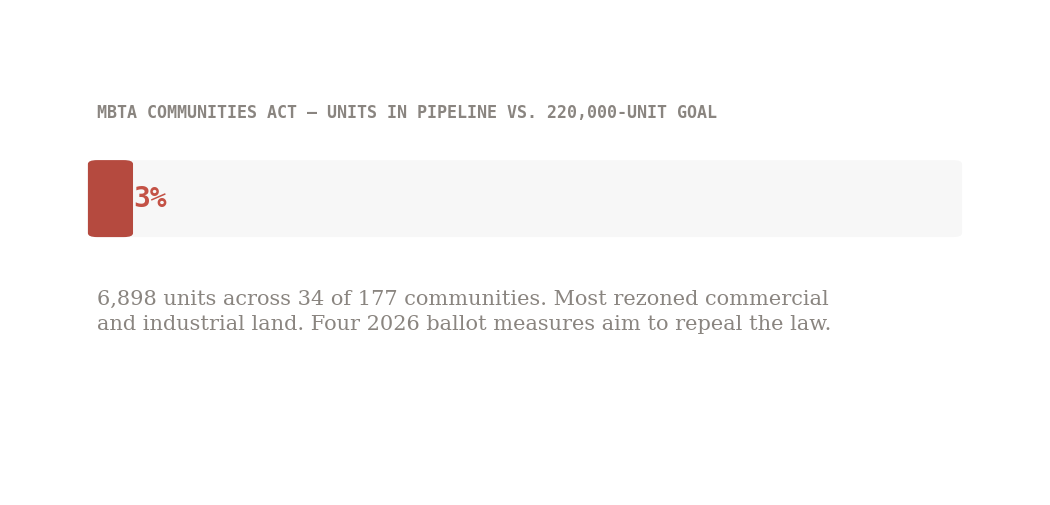
Boston adopted the parking recommendation, the one item on the list that changes nothing about what gets built on anyone's street, costs no politician a single vote, and can be announced at a press conference with the satisfying crunch of a policy that sounds like progress without requiring any. The lot sizes stayed. The by-right permitting stayed in the recommendations document. The single-family zoning ban went to the legislature, which has the bill somewhere and is not in a hurry. The Codman Square rezoning in Dorchester, which would have brought Squares + Streets by-right development to the neighborhood, was postponed to 2026 after pushback from residents worried about density, and Milton, the suburb that voted down its MBTA Communities Act compliance, was sued by the Attorney General and had 13 state grant programs pulled, and four separate 2026 ballot initiatives are organized to repeal the MBTA Communities Act itself, which would make Massachusetts one of the few states in America to actively undo a housing reform it already passed.
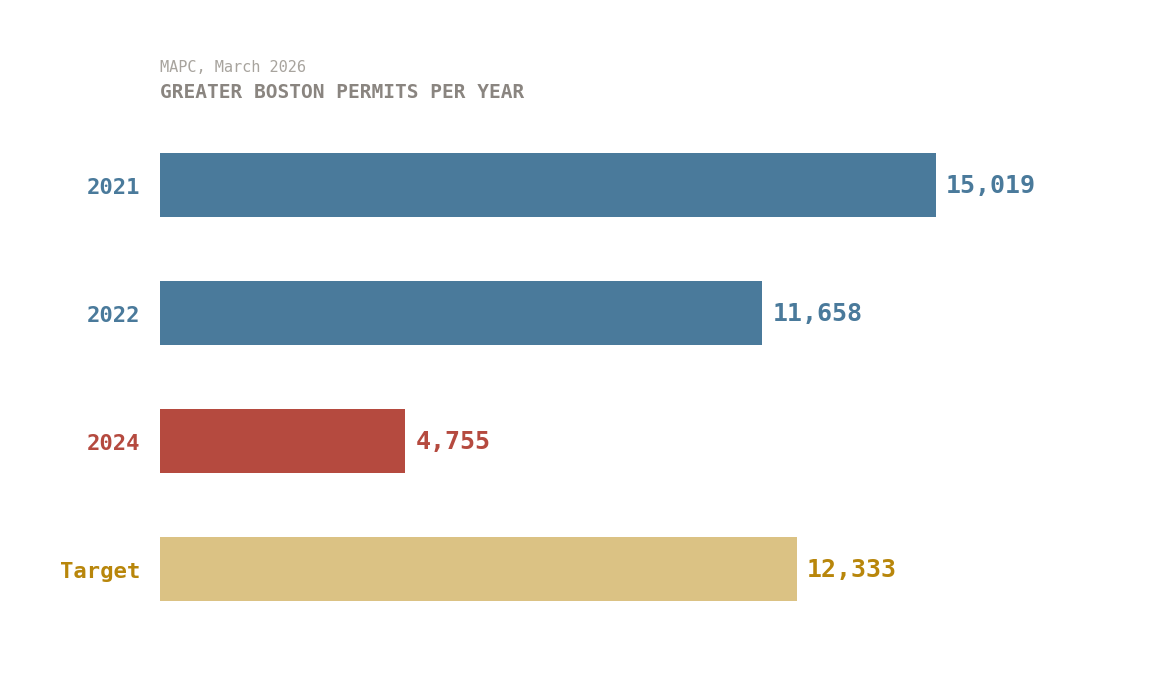
Greater Boston permitted 15,019 housing units in 2021 and has been declining since with the steady downward trajectory of a balloon losing air: 11,658 in 2022, roughly 8,000 in 2023, 4,755 in 2024, against a regional target of 12,333 a year that the Metro Mayors Coalition set for itself and is now meeting at roughly 39 cents on the dollar, a rate of progress that would reach the 2030 goal sometime around 2048 if nobody dies of old age waiting for a permit first.
05 / The price of admiring a solution you refuse to use
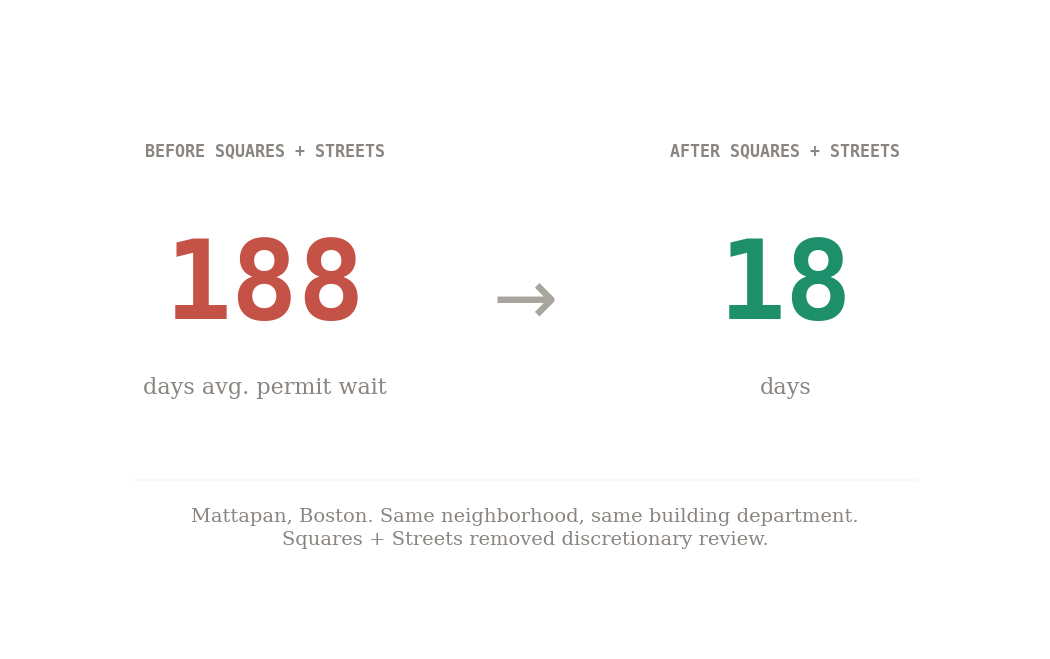
Austin at 89 square miles, wait, that's Boston, and the instinct to reach for geography as the explanation is the same instinct that reaches for "different cost of living" or "different economy" or any of the other comfortable reasons to believe the comparison doesn't apply, but Austin's most consequential reforms, the ones that actually moved the numbers, were about infill, about putting two or three homes on lots that already exist in neighborhoods that are already built, and you can do that on a peninsula as easily as you can on a prairie, which is why Mattapan's permit times dropped 90% from a single zoning change that had nothing to do with geography and everything to do with permission.
Construction costs in Massachusetts run 25–40% higher than Texas, and 39,000 university students compete with working adults for the same apartments every September lease cycle, and the homeownership rate for 25-to-34-year-olds in Greater Boston has hit its lowest point since at least 1960, and somewhere in Cambridge a proposal published five days ago describes how to build triple-decker apartments on city-owned sliver lots for $100,000 a unit, using the housing form Boston invented on land the city already owns with construction methods that already work, and the only thing between that proposal and a building is a zoning code that would not have permitted the triple-deckers the proposal is modeled on, which were built before the code existed, by people who did not ask for permission, in a city that has spent the century since making sure nobody else can do the same thing again.
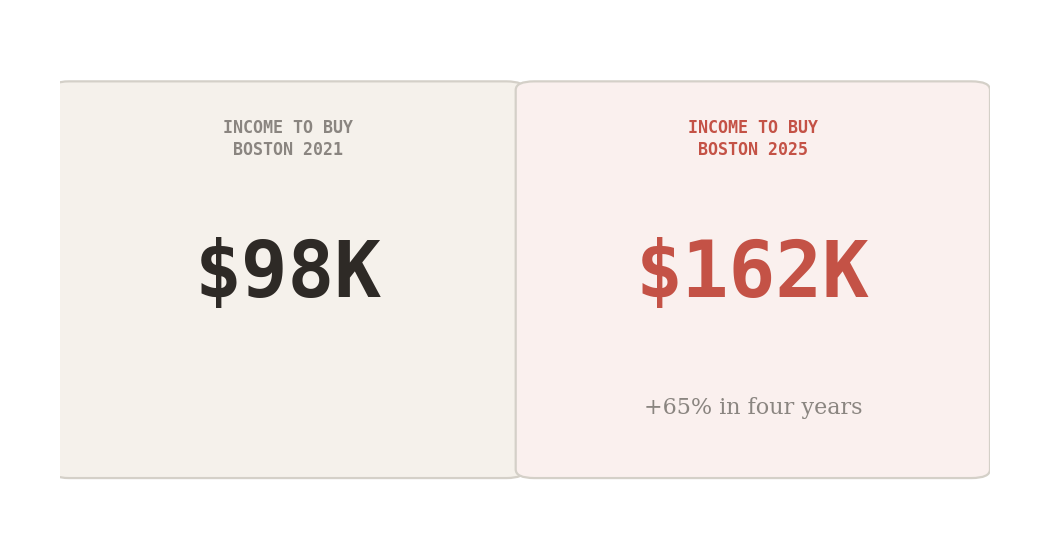
The generational dimension of this crisis has its own demographic skew, because housing costs that price out an entire age bracket do not fall evenly across the people inside it, and the groups already absorbing disproportionate labor market costs are the same ones least likely to clear a $162,000 income threshold for homeownership.
The question of whether any political party will run on this, rather than around it, connects to the larger question of whether either party has an economic vision that extends beyond the next press conference.
Sources:
- Pew Charitable Trusts, March 2026
- Boston Foundation / BU IOC Housing Report Card, Nov 2025
- Boston Indicators MBTA-C Pipeline, Jan 202
- Boston Indicators / Utile / JCHS Single-Stair Report, Oct 2025
- MAPC MMC Housing Task Force, March 202
- Harvard JCHS, 202
- Redfin Rental Tracker, Jan 2025
- Team Price Real Estate Austin, 2025Census ACS 2019–23
- CommonwealthBeacon, Nov 2025
- Visual Capitalist / NAR, Dec 2025
- BostonPads, 2025
- City of Austin HOME Report, 2024
- Austin Board of Realtors HOME analysis, April 2026
- Texas Public Policy Foundation, Dec 2025
- Mass.gov ADU law, Feb 2025
- Ballotpedia MA Lot Size Initiative, 2026
- Cambridge Day, April 2026
- MassINC Polling, May 2025
- Abundant Housing MA, Jan 2026